
Modeling
In this project, we modeled the relationship between the concentration of the enzyme in E. coli that converts alanine to pyruvate, the reaction time, and the pyruvate produced. We believed that modeling would allow us to find parameters, such as intracellular product concentrations, that would determine optimal enzyme expression in E. coli.
The reactions catalyzed by alanine dehydrogenase (AlaDH) include the following:
L-alanine + H2O + NAD+ ⇄ pyruvate + NH3 + NADH + H+ [1]
When there is sufficient substrate, the amount of alanine produced by AlaDH increases linearly with increasing concentration of AlaDH.[2] In addition, the coefficient of alanine and pyruvate is 1:1 in the reaction equation. Therefore, even in the reverse reaction, pyruvate formation reaction, there is a linear correlation between the amount of pyruvate produced and the concentration of AlaDH.
Therefore, the amount of pyruvate produced per hour in one E. coli is expressed as follows.
\[ \frac{d[pyruvate]}{dt} = \gamma[AlaDH] - \alpha[pyruvate] \]The term \( -\alpha[pyruvate] \) represents the negative effect of pyruvate on chemical reactions, such as an increase in pyruvate concentration making it harder for the reaction to proceed in the direction of pyruvate formation.
Let [pyruvate] = \( y_0 \) which [pyruvate] at \( t=0 \).
Solving the first equation, we get
\[ [pyruvate] = \frac{\gamma[AlaDH]}{\alpha} + (y_0 - \frac{\gamma[AlaDH]}{\alpha})e^{-\alpha t} \]Since AlaDH is always expressed in the transformed E. coli, the concentration of AlaDH in a single E. coli is constant.
The growth rate of E. coli follows the following logistic equation. [3]
\[ \frac{dN}{dt} = Nr(1-\frac{N}{K}) \](N = N(t): Number of E. coli at time t, K: Environmental Capacity, r: Internal rate of natural increase)
However, the expression of the AlaDH gene and excessive production of pyruvate may adversely affect the growth of E. coli. Therefore, we will try to predict the amount of intracellular pyruvate that can produce pyruvate with maximum efficiency.
The effect of AlaDH is expressed as follows:
\[ f(X_{AlaDH}) = \frac{1}{1+\alpha1 \cdot X_{AlaDH}} \]The effect of pyruvate is expressed as follows:
\[ g(X_{pyruvate}) = \frac{1}{1+\alpha2 \cdot X_{pyruvate}}\]The logistic equation, considering the effects of AlaDH and pyruvate, is as follows.
\[ \frac{dN}{dt} = Nr(1-\frac{N}{K})f([AlaDH])g([pyruvate]) \]Solving the above logistic equation yields
\[ N = \frac{KN_0}{N_0 + (K - N_0)exp(\frac{-rt}{(1 + \alpha_1[AlaDH])(1 + \alpha_2[pyruvate])})} \]The overall pyruvate abundance at time t is \([pyruvate] * N\). This can be expressed in terms of [pyruvate] and t as follows.
\[ [pyruvate] * N = [pyruvate] * \frac{KN_0}{N_0 + (K - N_0)exp(\frac{-rt}{(1 + \alpha_1\frac{\alpha([pyruvate] - y_0e^{-\alpha t})}{\gamma(1 - e^{-\alpha t})})(1 + \alpha_2[pyruvate])})} \]The graph of this equation is shown below.
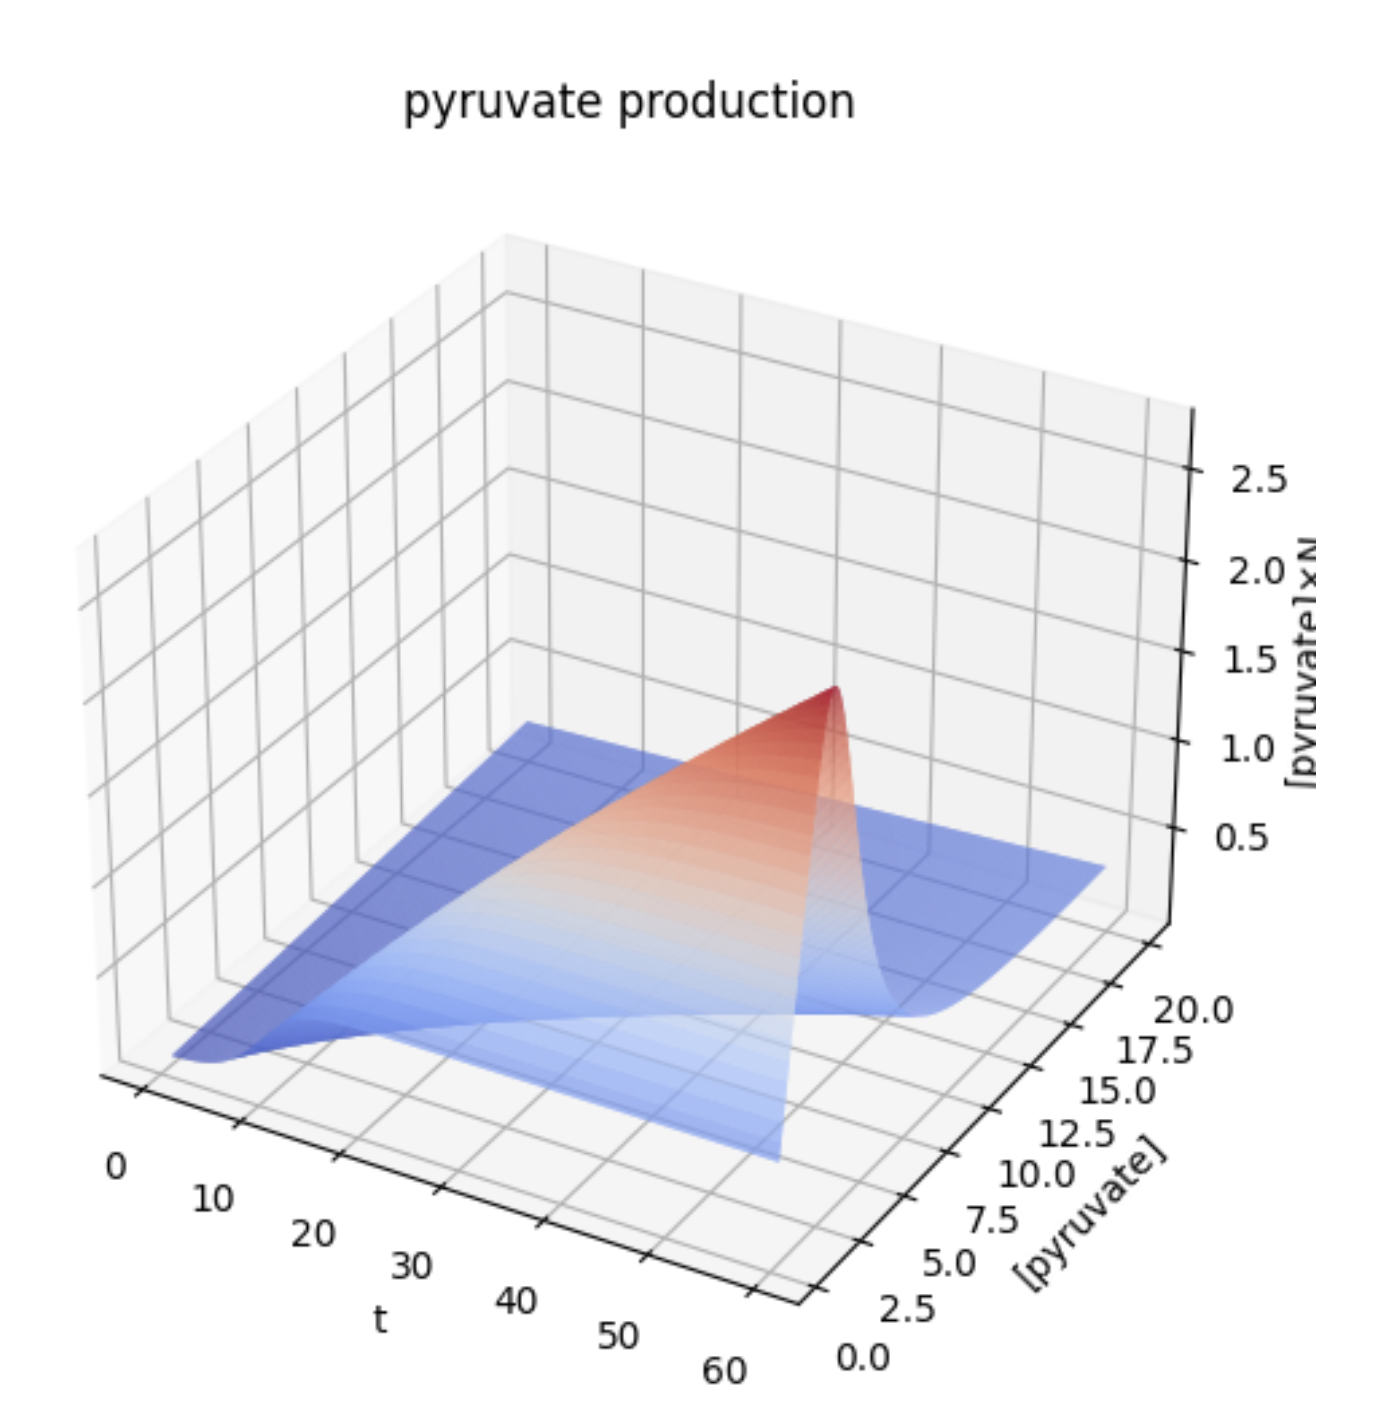
Since the z-axis is the amount of pyruvate present, i.e., the amount accumulated by time t, it is natural that the z-coordinate increases as t increases. On the other hand, the graph shows that if [pyruvate] is too high, the amount of pyruvate present decreases. Thus, since there is an optimal intracellular pyruvate concentration for E. coli to produce pyruvate, it follows that there is an optimal expression level of membrane proteins that efflux pyruvate. This means that expressing a lot of membrane proteins is not necessarily better.
In the current experiment, two types of membrane proteins that expel pyruvate were used, which also allows for the regulation of their expression. The extent to which the membrane proteins should be expressed will be clarified by repeating the experiment.
The graph shows that the value of [pyruvate] which takes the peak when the value of t is large is larger than the value of [pyruvate] whose z-coordinate peaks when the value of t is small. In other words, the pyruvate production may be greater if the value of [pyruvate] is adjusted to keep the value of [pyruvate] higher since it is expected to be left longer when it is put into practical use.
References
- OʼConnor RJ and Halvorson H, “The substrate specificity of L-alanine dehydrogenase”. Biochim. Biophys. Acta 48: 47‒55, Jul. 1960, doi:10.1016/0006-3002(61)90513-3
- Tobias J. Gmelch, Josef M. Sperl, and Volker Sieber,” Optimization of a reduced enzymatic reaction cascade for the production of L-alanine”, Sci Rep. 2019; 9: 11754. Published online 2019 Aug 13. doi:10.1038/s41598-019-48151-y
- A. McKendrick, M. Pai, “The rate of multiplication of micro-organisms: a mathematical study”, Proc. R. Soc. Edinburgh, 31, 1912, pp. 649-653, 10.1017/S0370164600025426