Proof of Concept
Our team set out to develop a pipeline for suspending E. coli cells in ATPS droplets, thus priming the droplets for cell lysis and the production of cell-free extract. The first step in this process is to optimize a protocol for suspending a maximal concentration of cells in the droplets, so that we can achieve a concentration of cell contents that is sufficiently high for use in detection systems.
Developing this protocol began by modifying the protocol used by Zhang et al. to suspend cell lysate in a similar ATPS protocell system [1]. Prior work identified 10w/v% Ficoll and 5w/v% 35k PEG as the optimal final polymer concentrations for achieving stable droplet formation, with the more polar Ficoll suspending the lysate and the PEG acting as the bulk phase [1]. Thus, we began by testing if it was possible to suspend entire cells inside these ATPS protocells with the following protocol:
- Grow bacteria to exponential growth phase
- Pellet 1mL of bacterial culture by centrifuging for 1min at 9000rpm
- Remove supernatant
- Wash two times with 1mL of PBS buffer by resuspending, pelleting, and removing PBS
- Resuspend cell pellet in some volume V of 2X concentration Ficoll = 20w/v%
- Mix Ficoll-cell suspension with equal volume V of 35k PEG at 2X concentration = 10w/v%
- Vortex for 1 minute
- Pipette 3µL of suspension onto slide and perform microscopy.
Bacterial cells and ATPS droplets were visualized using an EVOS M5000 diffraction microscope. We chose to use DE29, a strain of E. coli that has been modified to constitutively express GFP, thus allowing each bacterial cell to be visually captured under fluorescence microscopy. As we worked to optimize our protocol, we often used broad, qualitative observations to interpret whether a particular protocol change had been beneficial or harmful.
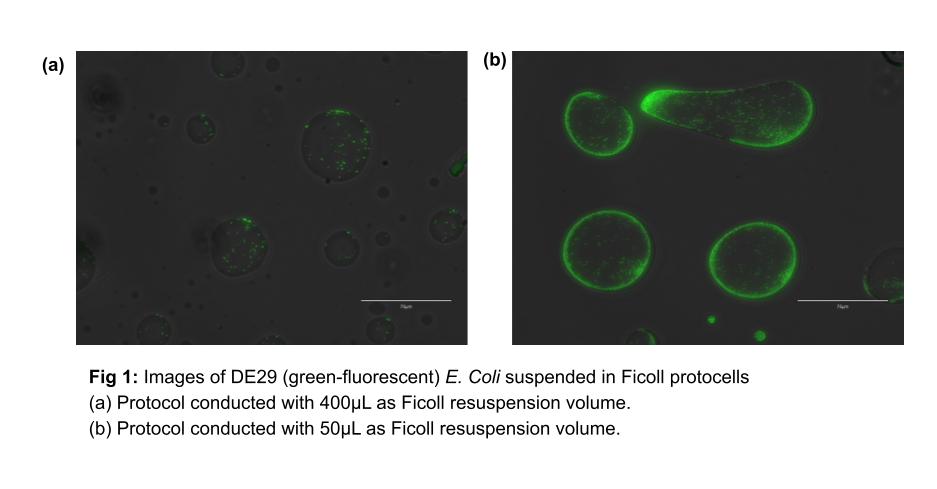
For instance, consider the differences between Fig. 1a and 1b. These initial experiments were performed with the aforementioned protocol, using 400µL and 50µL of Ficoll for the cell pellet resuspension, respectively. Based on these initial experiments, we concluded that higher concentrations of bacteria relative to Ficoll volume were worth exploring further as we attempt to increase cell density within the protocells.
Having proven it is possible to suspend E. coli cells within the protocells, we quickly moved towards identifying what variables in the protocol could be changed to optimize for maximal cell density per protocell and maximal integrity of the droplets. The variables tested and observed during our engineering process are:
- Ratio between Ficoll resuspension and volume of cell culture pelleted
- Duration of vortexing
- Microscopy techniques:
- Slides and coverslips
- Clear-bottom 384-well plate
- Clear-bottom 96-well plate
- Dilution needed to achieve monolayer on 96 well plate
- How much to put in the 96 well plate
- Protocell stability via timelapse
- How to get the cells to keep growing while in protocell
These variables naturally fall into three primary categories. As such, we began systematically performing experiments to address these three categories: 1) optimizing protocell size and bacterial concentration, 2) optimizing imaging quality and microscopy techniques, and 3) examining properties of the bacteria while suspended in the droplet.
Optimizing Protocells
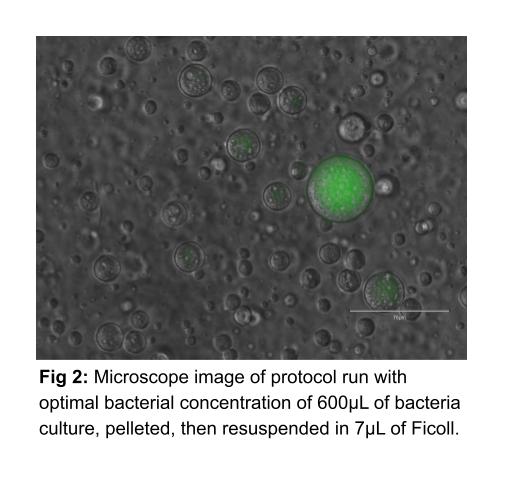
To develop this pipeline, we used an iterative process of testing variables one at a time in order to find the optimal conditions for forming correctly sized droplets that contain high cell density and can be easily imaged. We began examining the concentration of the bacteria resuspended in Ficoll by varying the volume of Ficoll with which we resuspended bacterial pellets. We tested Ficoll volumes ranging from 400µL to 3µL of Ficoll per mL of bacteria culture before pelleting. We found the optimal concentration to be 600µL of bacteria solution, which is pelleted, and then resuspended in 7 µL of Ficoll. This ratio between bacteria culture and Ficoll solution causes high concentration of bacteria within protocells with minimal leakage of cells outside protocells into the surrounding PEG solution (Fig 2).
We also observed during our protocol that as we remove media from our bacterial pellets and wash in PBS, some small volume of the wash buffer remains before pellets are resuspended Ficoll. In order to test whether this contamination affects protocell integrity, we ran our protocol entirely without the bacteria suspension. Instead, we mimicked the wash buffer contamination by adding varying volumes of water (from 0µL to 5µL) into the Ficoll-PEG mixture before vortexing, in order to identify a range of contaminant volumes that the protocells are able to tolerate. From this experiment, we found protocell formation was unaffected so long as there was 3µL or less of water. When more water was present, protocells became much smaller and unstable. This threshold is greater than the amount of remnant medium typically found after the spin and wash process for cells, suggesting that our protocells are stable enough to account for human error.
Next, we sought to optimize the length of time that the Ficoll solution and PEG are vortexed together before imaging. Our criteria for success was to make protocells as uniformly sized and stable over time as possible. We tested vortex times ranging from 30 seconds to 3 minutes, and determined that the best vortex time was 30 seconds.
Optimizing Imaging Quality
We then moved on to determining how to better image the protocells so that we might be able to use computer vision and computationally calculate cell density within each droplet. The end goal is to observe a monolayer of protocells, as opposed to multiple overlapping layers of droplets.
We initially used microscopy slides with coverslips and tested various volumes of Ficoll:PEG solution to see which volume led to the most stable protocell formation. However, we realized that the coverslips were compressing the protocells, distorting their size and pushing them to fuse with one another, so we switched to imaging our protocell solution in clear-bottom 384-well plates. Although we tried to use small volumes of sample with these plates, the miniscule size of each well resulted in our images capturing multiple layers of protocells, resulting in poor quality images.
Finally, we tried imaging on clear-bottom 96-well plates, and found that this medium for microscopy was most successful. After trying various volumes of protocell solution to image, we identified 30µL to be the minimal amount we could use in a 96-well plate while still completely covering the bottom of the well. However, there still remained a few layers of protocells in our microscope images when the normal protocol was carried out. Thus, we then attempted various extra dilutions of the protocell solution with additional 35k PEG solution and optimized a dilution ratio of 10µL of protocell solution mixed with 490µL of PEG. When this diluted solution of protocells is imaged on the 96-well plate with 30µL plating volume, we are able to obtain near-monolayers of protocells. (See Fig 2, above, for an example image.) In the end, our final optimized protocol is as follows:
- Grow bacteria to exponential growth phase
- Pellet 1.5mL of bacterial culture by centrifuging for 1min at 9000rpm
- Remove supernatant
- Wash two times with 1mL of PBS buffer by resuspending, pelleting, and removing PBS
- Resuspend cell pellet in 7µL of 2X concentration Ficoll = 20w/v%
- Mix Ficoll-cell suspension with 7µL of 35k PEG at 2X concentration = 10w/v%
- Vortex for 30 seconds
- Remove 4µL of the protocell mixture so that there is now 10µL remaining.
- Add 490 µL of the 35k PEG solution and pipette up and down to mix.
- Pipette 30µL of this diluted protocell mixture into a 96-well plate and perform microscopy.
While the ultimate goal of this imaging optimization was to produce a dataset of images useful for computer vision analysis, we had trouble with our initial attempts to segment the protocell outlines and quantify the level of fluorescence within the protocells. As a result, work to numerically quantify the observed concentration of E. coli in each protocell is ongoing.
Behavior of E. coli in Protocells
At this stage, we could reliably create, see, and capture images of protocells with suspended E. coli. Next we wanted to see how stable the protocells were over long periods of time. In our initial observations, we saw that protocells had very minimal if any movement once under a microscope and seemed to remain stable. That is, protocells did not collide into each other, merge, or burst when left alone in the 96-well plates. To test whether this was true over longer spans of time, we captured a timelapse of our protocells, confirming that these protocells are in fact very stable over up to 4 hours.
Lastly we checked to see if it was possible to induce lysis in our E. coli cells while they were suspended in Ficoll. We transformed the DE29 E. coli with our pBAD driven T4 lysis cassette (see Contribution page for more details,) and remade our stock Ficoll solution by dissolving the solid Ficoll in a LB+arabinose mixture to allow the cells to continue their translation mechanism for lysis. We observed that in the LB+arabinose Ficoll droplets, our transformed E. coli cells did lyse over time, as seen with the decrease in fluorescence (see Fig 4a) whereas in the negative control, no lysis occurred (see Fig 4b.)
Fig 3:
a) Lysis of E. coli in protocells when induced by arabinose
b) No lysis of E. coli in protocells in absence of arabinose
[1] Zhang, Y., Kojima, T., Kim, G.-A., McNerney, M. P., Takayama, S., & Styczynski, M. P. (2021, September 29). Protocell arrays for simultaneous detection of diverse analytes. Nature News. https://www.nature.com/articles/s41467-021-25989-3